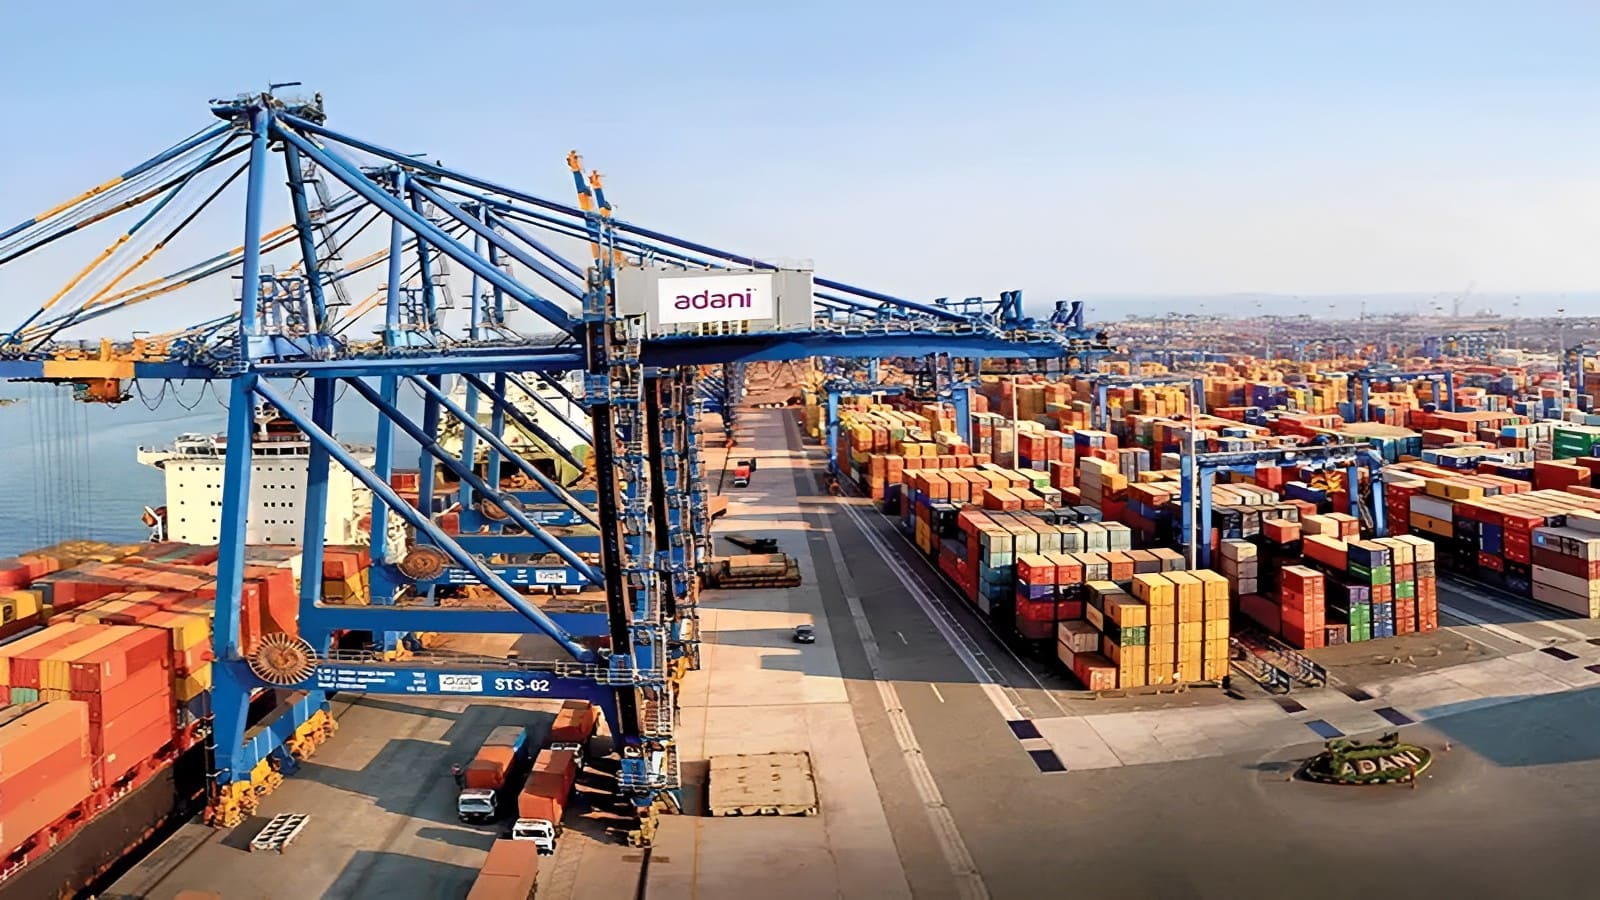
Adani Ports and Special Economic Zone Ltd releases Consolidated Financial Results for December 31, 2022.
Financial Results (Q3 FY2023) – Quarter-over-Quarter Comparison:
Total income of Adani Ports and Special Economic Zone Ltd is Rs.5051.17 Crores (December 31, 2022) vs. Rs.5648.91 Crores (September 30, 2022)
Net profit/loss: Rs.1315.54 Crores (December 31, 2022) vs. Rs.1677.48 Crores (September 30, 2022)
EPS: Rs.6.09 (December 31, 2022) vs. Rs.7.77 (September 30, 2022)
| Financials | Q3 FY2023 | Q2 FY2023 | % Change |
| Total Income | ₹5051.17 Cr | ₹5648.91 Cr | ⬇ -10.58% |
| Net Profit | ₹1315.54 Cr | ₹1677.48 Cr | ⬇ -21.58% |
| EPS | ₹6.09 | ₹7.77 | ⬇ -21.62% |
Financial Results (Q3 FY2023) – Year-over-Year Comparison:
Total income of Adani Ports and Special Economic Zone Ltd is Rs.5051.17 Crores (December 31, 2022) vs. Rs.4713.37 Crores (December 31, 2022)
Net profit/loss: Rs.1315.54 Crores (December 31, 2022) vs. Rs.1567.01 Crores (December 31, 2022)
EPS: Rs.6.09 (December 31, 2022) vs. Rs.7.25 (December 31, 2022)
| Financials | Q3 FY2023 | Q3 FY2022 | % Change |
| Total Income | ₹5051.17 Cr | ₹4713.37 Cr | ⬆ 7.17% |
| Net Profit | ₹1315.54 Cr | ₹1567.01 Cr | ⬇ -16.05% |
| EPS | ₹6.09 | ₹7.25 | ⬇ -16.00% |
Financial Results (9 Months Ended FY2023) – Year-over-Year Comparison:
Total income of Adani Ports and Special Economic Zone Ltd is Rs.16226.27 Crores (December 31, 2022) vs. Rs.14603.43 Crores (December 31, 2021)
Net profit/loss: Rs.4151.30 Crores (December 31, 2022) vs. Rs.3783.42 Crores (December 31, 2021)
EPS: Rs.19.22 (December 31, 2022) vs. Rs.17.52 (December 31, 2021)
| Financials | 9 Months Ended FY2023 | 9 Months Ended FY2022 | % Change |
| Total Income | ₹16226.27 Cr | ₹14603.43 Cr | ⬆ 11.11% |
| Net Profit | ₹4151.30 Cr | ₹3783.42 Cr | ⬆ 9.72% |
| EPS | ₹19.22 | ₹17.52 | ⬆ 9.70% |
For More Latest News Click Here


